What The Birthday Paradox Can Teach You About A/B Testing
Three years ago, the Convertize team was made up of just 25 people. By happy coincidence, two of our team members were born on the same day: 7 July. We thought it was pretty exceptional to have two members of such a small team with the same birthday so we decided to use it as an excuse for a celebration and went out to dinner all together that evening. But was it actually that exceptional? What would have been the statistical chance of finding the same result from a group of 25 people put together completely at random, for example?

A rather surprising statistical result…
It seems like a simple mathematical question, yet a lot of us would guess the answer incorrectly…
In your opinion, knowing that there are 365 days in the year (discounting leap years), what are the chances of finding 2 people with the same birthday in a group of 25 people?
- 1 out of 365, so around 0.3%?
- 2 out of 365, so around 0.5%?
- 25 out of 365, so around 7%?
Wait for it! It’s none of the above…the chances of finding two people with the same birthday in a group of 25 randomly selected people is actually 56%! That’s more than a one in two chance! This figure then grows to almost 90% for a group of 40 people! So in our team situation of 25 people, it would actually be more exceptional to not find two people with the same birthday. Pretty surprising, no?
These results are proven, easily worked out with a quick calculation, and have been verified in reality. Why not test it out yourself?! In your office, social circle, your kid’s classes…anywhere you can think of you’re likely to find more people with the same birthday than you’d think.
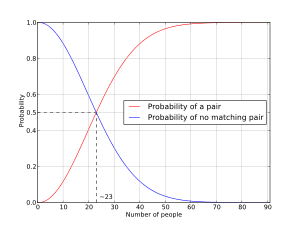
In red is the probability of finding two individuals with the same birthday, relating to the number of people within any one test group
AB Testing and Significativity: Help is at hand!
It is therefore essential to be wary when it comes to statistics, because it isn’t intuitive. Even if a figure seems exceptional to you, it could still be within the normal range. It is the same where conversion rate optimisation is concerned: never draw hasty conclusions from your data!
For example, a couple of months ago one of my clients asked me why were weren’t implementing a site variation that had led to 20 more conversions than the original during the first week of an AB test. I explained that in light of the other data (the amount of traffic during the week: only 10,000 unique visitors, the conversion rate of the original version: 10%, etc.) these 20 extra conversions weren’t significant enough to give us any solid information on the variation’s performance. In fact, finding this sort of random fluctuation is a regular occurrence in AB testing, just as finding 2 people in a group of 25 who have the same birthday is perfectly normal. Therefore it would have been an ill-advised decision to immediately implement the variation based on this statistically insignificant increase in conversions.
In this type of situation, don’t risk misinterpreting statistics as it is so easy to go wrong. If you’re trying to teach yourself through looking on the Internet, you risk getting caught up in confusing concepts and contradictory sources. Better to get help instead! Convertize (a new solution currently accessible by invitation) will automatically calculate the duration and significativity of your tests, so you don’t need to interpret the figures.
But if you just can’t get enough of statistics then you could also use abtesting.ninja to calculate the significativity of your AB tests.
by Benjamin Ligier
Benjamin is a CRO Expert at Convertize. He is passionate about design, web marketing and consumer psychology.